Which of your accounts actually make money?
Every account in your book was profitable on the day you bid it. You walked the building, counted the restrooms, estimated the hours and set a price that left room for margin. The numbers worked.
The trouble is that the bid describes the building as it was on that walkthrough. Six months or 3 years later, the building has changed, the client's expectations have changed and the way your crew actually cleans it has changed. The price usually hasn't.
That gap between the account you bid and the account you're actually running is where most profit leaks out. You don't need an accounting degree to find it. You need to put each account's original bid next to what's really happening there.
Why good accounts quietly go bad
Accounts rarely become unprofitable in one big moment. They drift, a little at a time, in ways that are easy to miss from the office:
- Hours creep up. A crew that was supposed to finish in 3 hours now takes 3 and a half. Maybe the tenant added staff, maybe the building got busier, maybe a new cleaner is still learning the route. Half an hour a night is easy to shrug off. Over a year it's more than 120 hours of labor you never priced.
- Extra work becomes regular work. The client asks for the break room fridge to be wiped out "just this once." Then it's every Friday. Small favors are part of keeping clients happy, but when they turn into routine tasks, they belong in the price.
- Supplies run heavier than planned. A building with more traffic than expected goes through liners, paper and soap faster. If supply requests come in by text, nobody totals them per site.
- Fixes take return trips. When a problem gets missed and someone drives back to fix it, that trip costs you labor and fuel that the bid never included.
None of this means your crews are doing anything wrong. It means the building is asking for more than you're charging for, and nobody has gone back to check.
The bid-versus-actual check
The simplest way to find your money-losing accounts is to compare four numbers for each one: what you planned and what's actually happening. Here's how to do it.
1. Pull the original bid assumptions
Find the bid or pricing sheet for each account and write down what you assumed: labor hours per week, cleaning frequency, scope of tasks and any supply budget.
If you priced an account by feel and never wrote it down, use the monthly price and your target labor percentage to work backward to the hours you could afford.
2. Compare bid hours to clocked hours
This is the most important number, because labor is usually the biggest cost on any account. Total the hours actually worked at each site over the last 4 weeks and compare them to the bid.
A difference of a few percent is normal. A site running 15 or 20 percent over is a site where your margin has mostly disappeared. This step only works if you know who worked where and for how long.
If hours are tracked on paper timesheets or reported by text, getting accurate numbers per site is the hardest part, and it's worth fixing first.
3. List the work outside the original scope
Go through the last few months of client requests and extra tasks for each account. Which ones were one-time favors, and which ones now happen every week?
Anything recurring that wasn't in the original scope is unbilled work.
4. Total supplies and return trips
Add up what each site used in supplies and how many times someone went back to fix a problem. A site that needs a return trip every couple of weeks has a quality issue and a cost issue at the same time.
A worked example
Here's how the check plays out at a hypothetical 3-story office building.
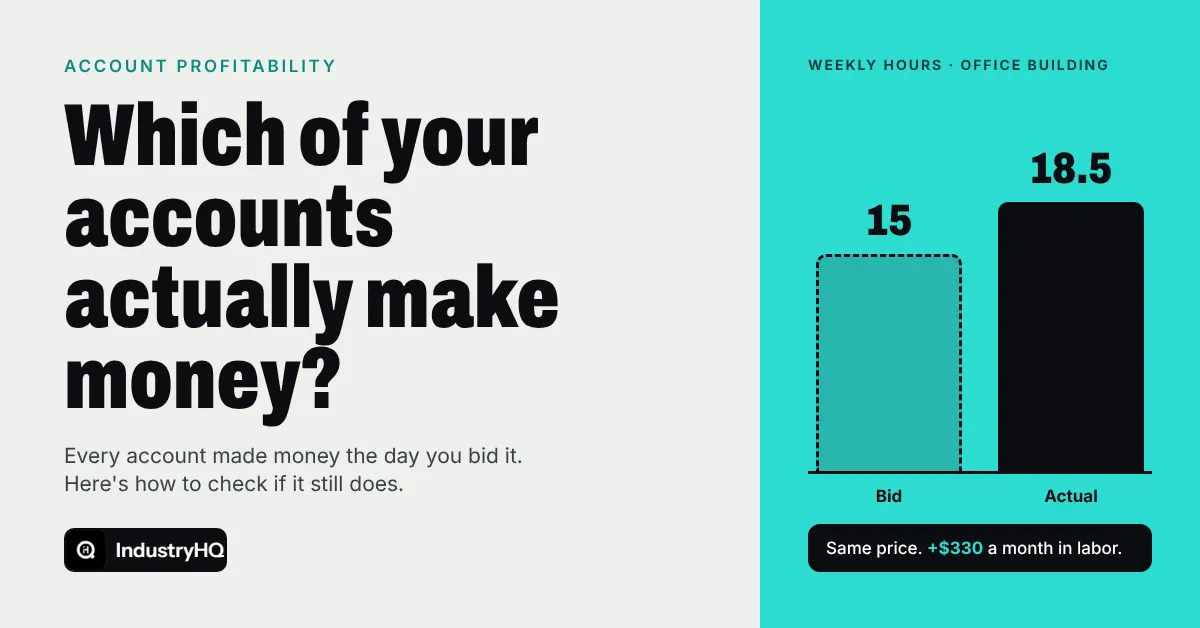
The account was bid 2 years ago at 15 hours a week, 5 nights a week, for $2,400 a month. At a loaded labor cost of $22 an hour, that's about $1,430 a month in labor, leaving a healthy margin after supplies.
When the owner runs the check, here's what turns up:
- Hours: The crew has averaged 18.5 hours a week over the last month. The tenant on the second floor doubled its headcount last spring.
- Scope: The client asked for the conference rooms to be reset after evening meetings. It started as an occasional request and now happens 3 nights a week.
- Supplies: Paper and liner use is up by about a third, in line with the extra headcount.
- Return trips: 2 in the last month, both for restrooms on the busy second floor.
Labor alone is now about $1,760 a month, up more than $300 from the bid. Add the heavier supply use and the return trips, and an account that looked solid is running close to break-even.
The fix isn't to cut corners. The owner goes back to the client with the facts: the building has more people in it, the conference room resets are a regular service now and here's what that costs. Most clients understand a price adjustment when it's backed by clear numbers. If they don't, at least the owner is making that decision with open eyes.
Warning signs to watch for
You don't have to run a full check on every account every month. These signs tell you which ones to look at first:
- Crews regularly clock out later than the schedule says they should.
- The client sends more requests than other accounts of the same size.
- Supply requests from one site come in noticeably more often.
- Supervisors keep getting called back to the same building.
- The account hasn't had a price review since it was signed.
Start this month
Pick your 5 largest accounts and run the bid-versus-actual check on each one. Write down the 4 numbers: bid hours versus clocked hours, recurring out-of-scope tasks, supply use and return trips.
Then sort them into 3 groups. Accounts close to their bid need nothing. Accounts with operational drift, like a slow route or too many return trips, need a fix on your side. Accounts where the building itself has changed need a conversation with the client about price.
After that, make it a routine. Check every account at least once a year, and well before any renewal.
Where IndustryHQ fits
IndustryHQ keeps the numbers for this check in one place. The GPS time clock records who worked at each site and for how long, so you can see clocked hours by account without collecting timesheets, and profit per client and per site is a live number. Client requests and fixes are tracked as work orders, so recurring extra work is easy to spot.
Supply requests come in from crews' phones and are logged by site. Unlimited users are included on every plan, so every cleaner can clock in and every supervisor can log what they see.
Start a free 14-day trial or book a demo at industryhq.io.